Debugging Drupal in Lando using (Neo)vim and Vdebug

With the introduction of OOP on Drupal 8, it has become a bit difficult for me to track how Drupal processes each request. Most of the time, you’ll be dealing with different objects, track down which class were instantiated and methods that were called, and inspect the variables.
Tools
So what are the tools that I am using? I’ve been a long time user of vim and recently just switched to Neovim. For development environment, I mostly jump between different methods for building Drupal but recently have been using Lando.
Lando
For the configuration, simply setting xdebug to true so that Lando would enable xdebug in the environment:
name: drupal
recipe: drupal8

services:
  appserver:
    webroot: web
    xdebug: true
    config:
      php: config/php.ini
For config/php.ini, I simply followed the one from setting up vscode:
[PHP]

; Xdebug
xdebug.max_nesting_level = 256
xdebug.show_exception_trace = 0
xdebug.collect_params = 0
; Extra custom Xdebug setting for debug to work in VSCode.
xdebug.remote_enable = 1
xdebug.remote_autostart = 1
xdebug.remote_host = ${LANDO_HOST_IP}
; xdebug.remote_connect_back = 1
xdebug.remote_log = /tmp/xdebug.log
(Neo)vim
For (Neo)vim, Vdebug seems to be the only option for using Xdebug in PHP. A minimal configuration can be:
call plug#begin(stdpath('data') . '/plugged')
Plug 'vim-vdebug/vdebug'
call plug#end()

if !exists('g:vdebug_options')
  let g:vdebug_options = {}
endif

let g:vdebug_options.path_maps = {
    \  '/app' : getcwd(),
\ }

let g:vdebug_options.break_on_open = 0
let g:vdebug_options.watch_window_style = 'compact'

if !exists('g:vdebug_features')
  let g:vdebug_features = {}
endif

let g:vdebug_features.max_children = 128
vdebug_options.path_mapssets the paths so that it works with Lando. Due to thegetcwd()value, you’ll need to make sure that before starting (Neo)vim, you’re current working directory would be your workspace i.e. whatever is mounted on ‘/app’ inside Lando.
vdebug_features.max_childrenallows inspecting variables from Drupal most of the time.
For other options, they can be found on :h Vdebug.
Debugging
Consider the scenario where you are viewing a node and wanted to debug the method \Drupal\node\Entity\Node::getType(). To start debugging, open the file core/modules/node/src/Entity/Node.php and set a breakpoint using F10, start the debugger using F5, and finally visit a single node.
I’m not entirely sure of the actual definitions for step debugging although in my own words, I can probably explain them like these:
- Step over: continue to the next line in the source.
- Step into: if the line calls a certain function/method, then go over to that function/method where you can then continue debugging.
- Step out: skip the remaining lines and proceed to the next step.
Bindings
From the configuration above, it mostly just relies on the default bindings (:h VdebugKeys):
let g:vdebug_keymap = {
\    "run" : "<F5>",
\    "run_to_cursor" : "<F9>",
\    "step_over" : "<F2>",
\    "step_into" : "<F3>",
\    "step_out" : "<F4>",
\    "close" : "<F6>",
\    "detach" : "<F7>",
\    "set_breakpoint" : "<F10>",
\    "get_context" : "<F11>",
\    "eval_under_cursor" : "<F12>",
\    "eval_visual" : "<Leader>e",
\}
User interface
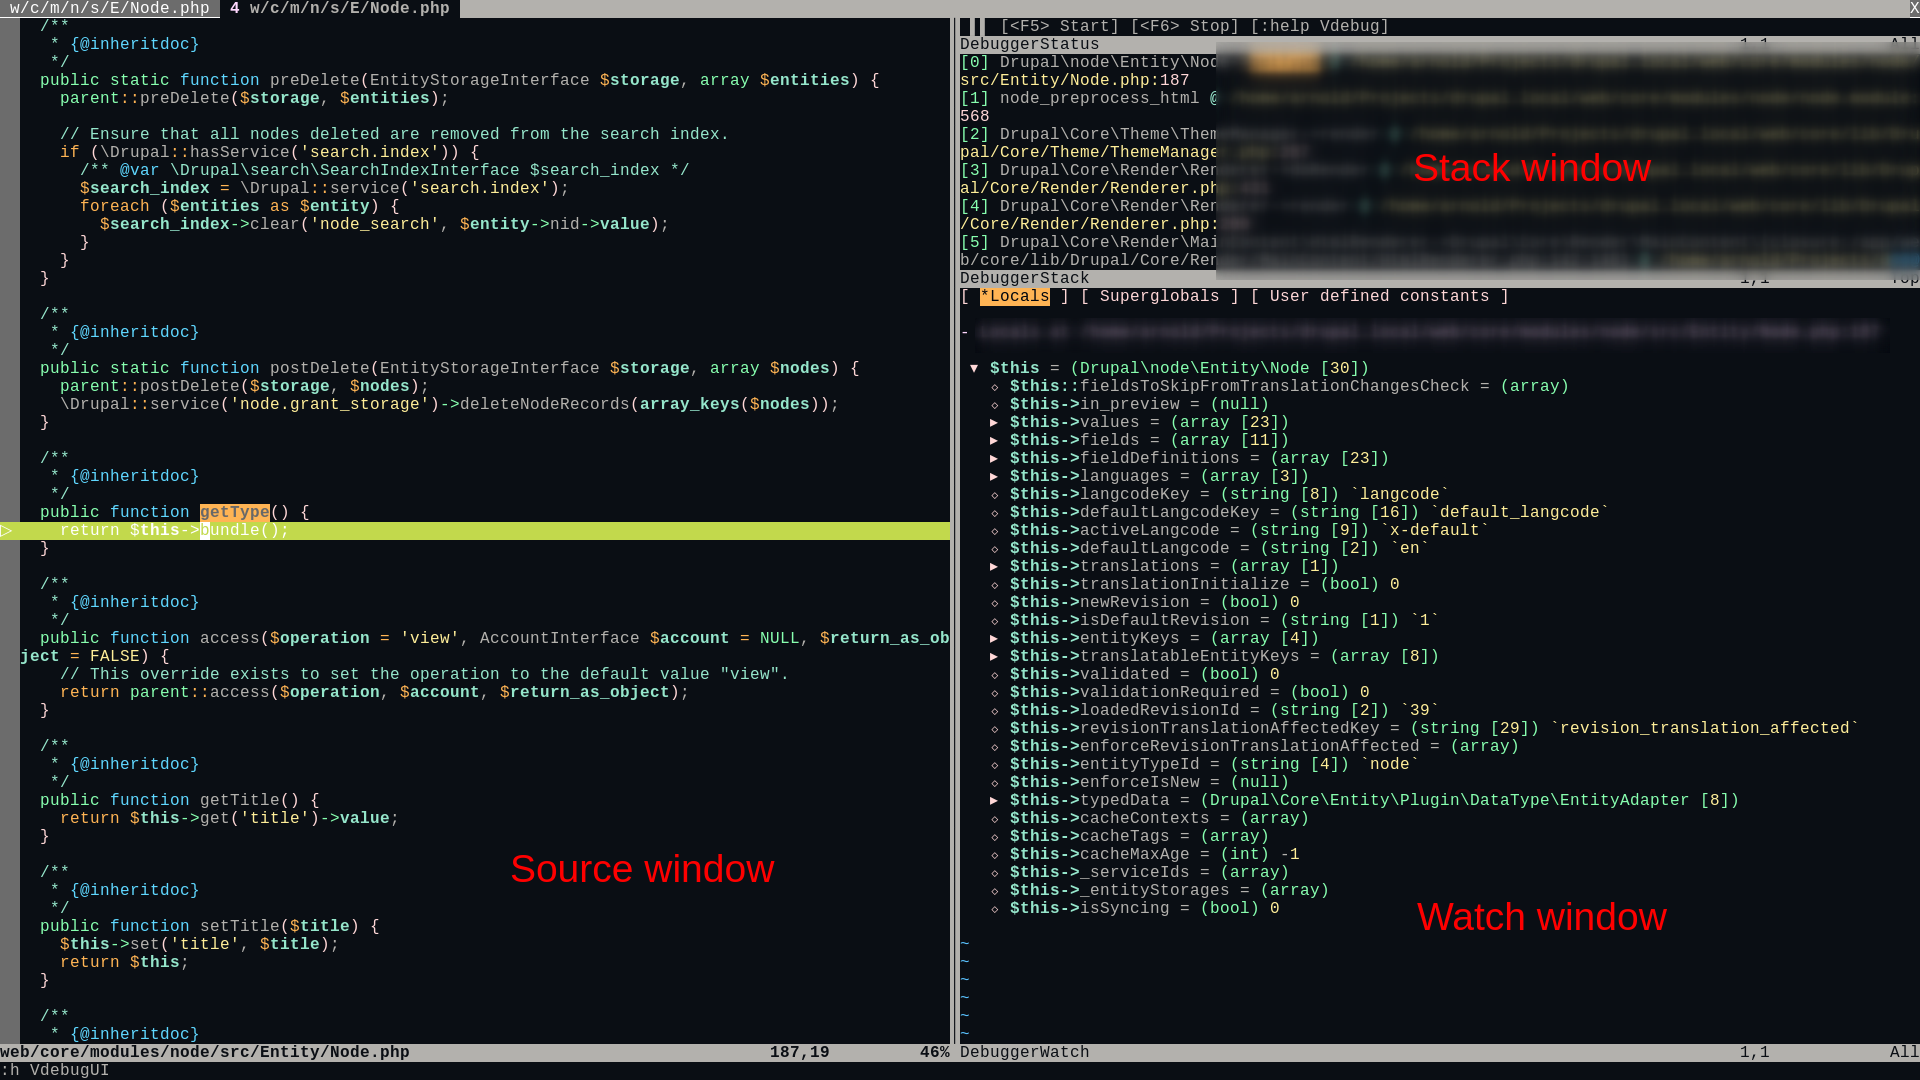
The explanation for each window can be found at :h VdebugUI. I find the “Watch” window very helpful since I can inspect the different variables with their context. Pressing Enter on a variable would expand/collapse their trees.
So far, I think these are the basic things to debugging with (Neo)vim using Vdebug. Vdebug has a lot of other features such as evaluating although I haven’t gone much further yet.