Rendering Charts in Drupal Using C3.js

One of the projects I’ve worked on before needed a chart that displays asset values for funds. The requirement was to allow editors to modify imported data and display it as a simple line chart in a content page using D3.js.
In order to accomplish this feature, the items I planned on doing were:
- Create a content type that stores the actual fund.
- Create a content type to store the asset values.
- Have a field to be displayed on the content page for funds.
- Display the asset values in a chart.
Since this is an example, the listed items are not complete/partially correct although they are somewhat similar.
Fund Content Type
The only field necessary for the “Fund” content type would just be the title. I simply created a new content type with some sane defaults and named it “Fund”.
Asset Value Content Type
For the “Asset Value” content type, I added three fields:
- Date - stores a date only data.
- Value - stores the asset value in decimal format.
- Fund - entityreference field referencing the “Fund” content type.
I originally added a paragraph field to the “Fund” content type although since the values contained a lot of data, the UI became slow and sluggish so I decided to just separate it. We then created a view to list the asset values which has necessary filtering for easy searching and editing of “Asset Value” content.
Chart Pseudo-field
The next item on the list is to allow administrators to display the chart on the “Fund” content type. In order to achieve this, I created a pseudo-field specific for the “Fund” content type. This way, the field can be displayed anywhere on the layout (“Layout Builder” supports this as well). Another option I can of is to create a custom Field Formatter which would be a more administrator-friendly approach.
Implementing hook_entity_extra_field_info()
The field needs to be declared first so that Drupal can find it:
...
/**
 * Implements hook_entity_extra_field_info().
 */
function custom_module_entity_extra_field_info() {
  $extra = [];

  $extra['node']['fund']['display']['chart'] = [
    'label' => t('Chart'),
    'description' => t('Chart for asset values.'),
    'weight' => 0,
  ];

  return $extra;
}
...
After declaring the field, you will have a new field in the “Manage display” tab for the “Fund” content type.
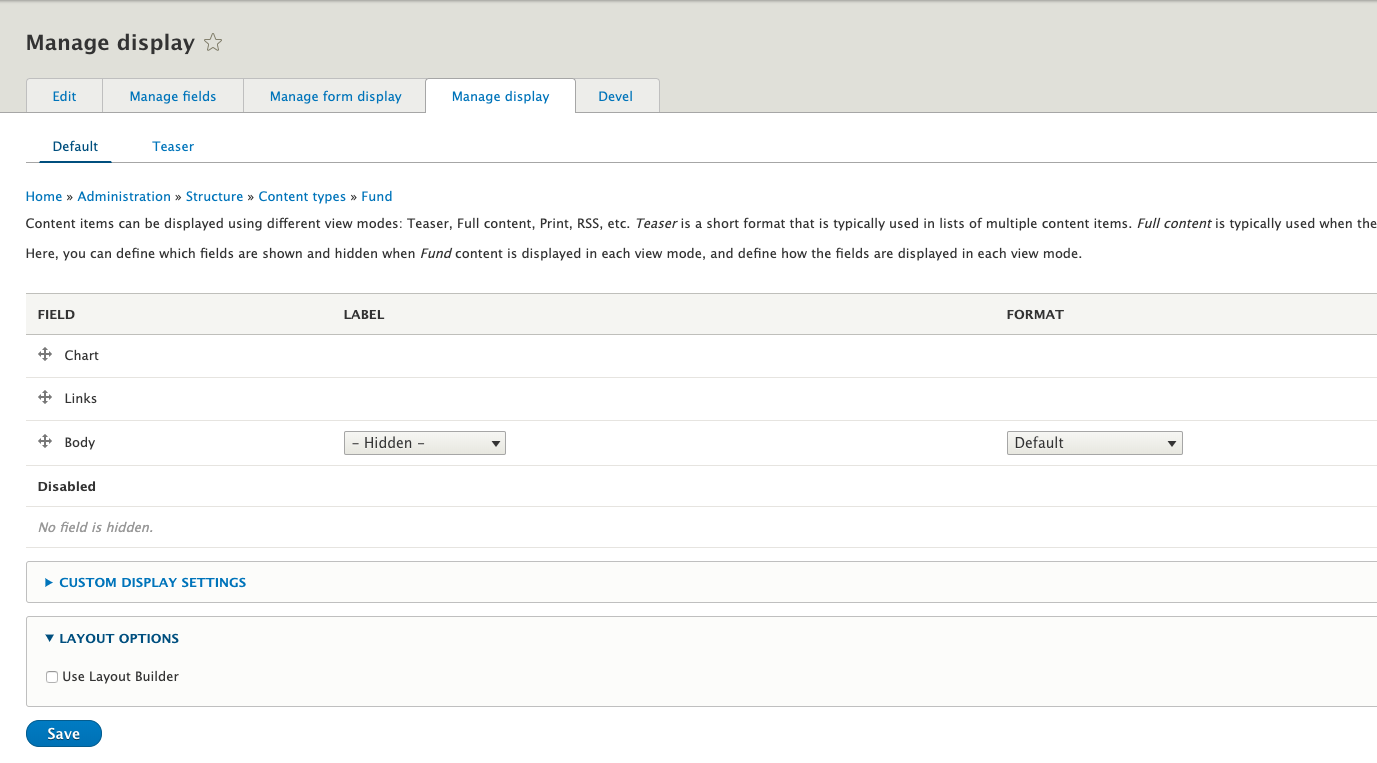
Implementing hook_ENTITY_TYPE_view()
What is needed next is to handle how the field would be displayed on the content page. The idea here is to grab all “Asset Value” content belonging to the “Fund” content type and display it as a renderable array which would then be populated by the chart library.
...
use Drupal\Core\Entity\Display\EntityViewDisplayInterface;
use Drupal\Core\Entity\EntityInterface;
...

/**
 * Implements hook_ENTITY_TYPE_view().
 */
function custom_module_node_view(&$build, EntityInterface $entity, EntityViewDisplayInterface $display, $view_mode) {
  if ($display->getComponent('chart')) {
    $storage = \Drupal::entityTypeManager()->getStorage('node');

    $query = $storage->getQuery()
                     ->condition('type', 'asset_value')
                     ->condition('field_fund.target_id', $fund->id())
                     ->sort('field_date');

    if (!empty($result)) {
      $values = $storage->loadMultiple($result);

      $data = [t('Date'), t('Value')];

      foreach ($values as $value) {
          $data[0][] = $value->get('field_date')->date->format('Y-m-d');
          $data[1][] = $value->get('field_value')->value;
      }

      $build['chart'] = [
        '#type' => 'container',
        '#attributes' => [
          'id' => 'chart-' . $entity->id() . '-wrapper',
          'class' => ['chart-wrapper'],
        ],
        '#attached' => [
          'drupalSettings' => ['customModule' => ['chart' => ['chart-' . $entity->id() => $data]]]
        ],
        'chart' => [
          '#type' => 'html_tag',
          '#tag' => 'div',
          '#attributes' => [
            'id' => 'chart-' . $entity->id(),
            'class' => ['chart'],
          ],
        ],
      ];
    }
  }
}
...
So far, the code just displays a simple container with the necessary “Asset Value” data belonging to the “Fund” content. The data is passed to drupalSettings so that the chart library will be able to use it. The data was specifically formatted for the chart library that will be used later on.
Chart
The requirement was to use D3.js to render the chart since the prototype based on it for the designs. I found D3.js to be a bit complex though and seemed to have a steep learning curve considering the timeline. Luckily, I was able to find a “wrapper” which was easy to use but still uses D3.js behind it — C3.js.
Drupal also happened to have a module for easy creating of charts — charts. It also happen to have support for C3.js. I did give it a try but I found that it offered too much features which makes it a bit difficult to customize for my needs. I find it really well written although I might need to do some digging in order to accomplish the needed requirement.
The project’s requirement isn’t actually to only display a chart but it also had other features mainly filtering of data by dates.
Adding the Library
First step needed was to include the library:
d3:
  version: 5.9.7
  js:
    https://cdn.jsdelivr.net/npm/d3@5.9.7/dist/d3.min.js: { type: external, minified: true }

c3:
  version: 0.7.3
  css:
    theme:
      https://cdn.jsdelivr.net/npm/c3@0.7.3/c3.min.css: { type: external, minified: true }
  js:
    https://cdn.jsdelivr.net/npm/c3@0.7.3/c3.min.js: { type: external, minified: true }
  dependencies:
    - custom_module/d3

custom-module:
  version: 1.0
  js:
    js/main.js: {}
  dependencies:
    - custom_module/c3
    - core/drupalSettings
    - core/jquery.once
    - core/drupal
    - core/jquery
I’ve included the D3.js, C3.js, and other basic, built-in libraries for the main javascript for the custom module which would be custom_module/js/main.js.
After declaring the library, I’ve attached it to the component added earlier:
...
'#attached' => [
  'library' => ['custom_module/custom-module'],
  'drupalSettings' => ['customModule' => ['chart' => ['chart-' . $entity->id() => $data]]]
],
...
Rendering the Chart
After having all the necessary items, I can now display the chart with C3.js:
(function ($, Drupal, drupalSettings) {
  Drupal.behaviors.customModule = {
    attach: function attach(context, settings) {
      $('.chart-wrapper', context).once('customModuleDisplayChart').each(function() {
        var id = $('.chart', this).attr('id');
        var data = settings.customModule.chart[id];

        var chart = c3.generate({
          bindto: '#' + id,
          size: { width: 930 },
          data: {
            x: 'date',
            columns: data,
            empty: {
              label: {
                text: 'No data',
              }
            }
          },
          axis: {
            x: {
              type: 'timeseries',
              tick: {
                format: '%d/%m/%Y',
                count: 6,
              },
            },
          },
          legend: {
            item: {
              padding: 10,
              tile: {
                width: 30,
                height: 2,
              },
            },
          },
          grid: {
            y: {
              show: true,
            }
          },
          point: {
            r: 0,
            focus: {
              expand: {
                r: 8,
              }
            }
          },
        });
      });
    }
  };
})(jQuery, Drupal, drupalSettings);
The example chart looks like this:
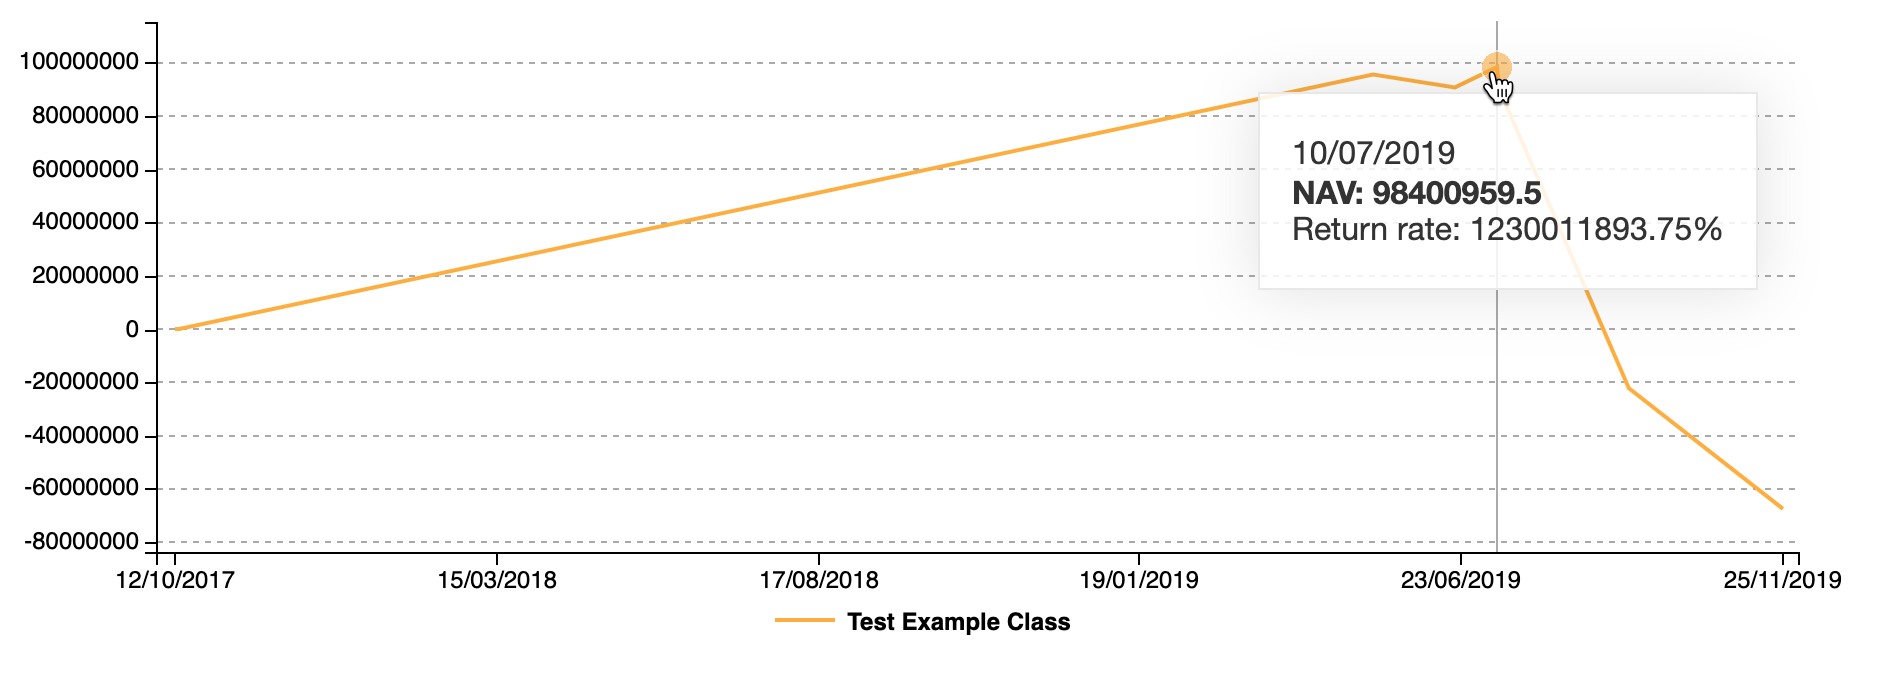
Most of the configurations are found on the documentation. The chart is not as configurable from the UI considering the chart will not change much and configuration is usually out of the scope of the task. One of the difficulties I had was to make the chart responsive. I had to do a bit of digging to actually get it to work. The trouble I had was that it was conflicting with some of the JS libraries I was using for the project.
There were some additional customizations for the actual project such as multiple charts, tooltips, filters, and link export (handled by views_data_export) although this example shows the basics.
All in all, I think the experience creating this feature was fun. I definitely learned a lot about C3.js. I find its usage somewhat similar to Highcharts and Chart.js.